Workout Route Heat Maps
Workout Wanderer colors a single route by what the workout recorded at each point on it. Its eight heat maps show how that workout went, not just where you went.
Try the heat maps on a sample route
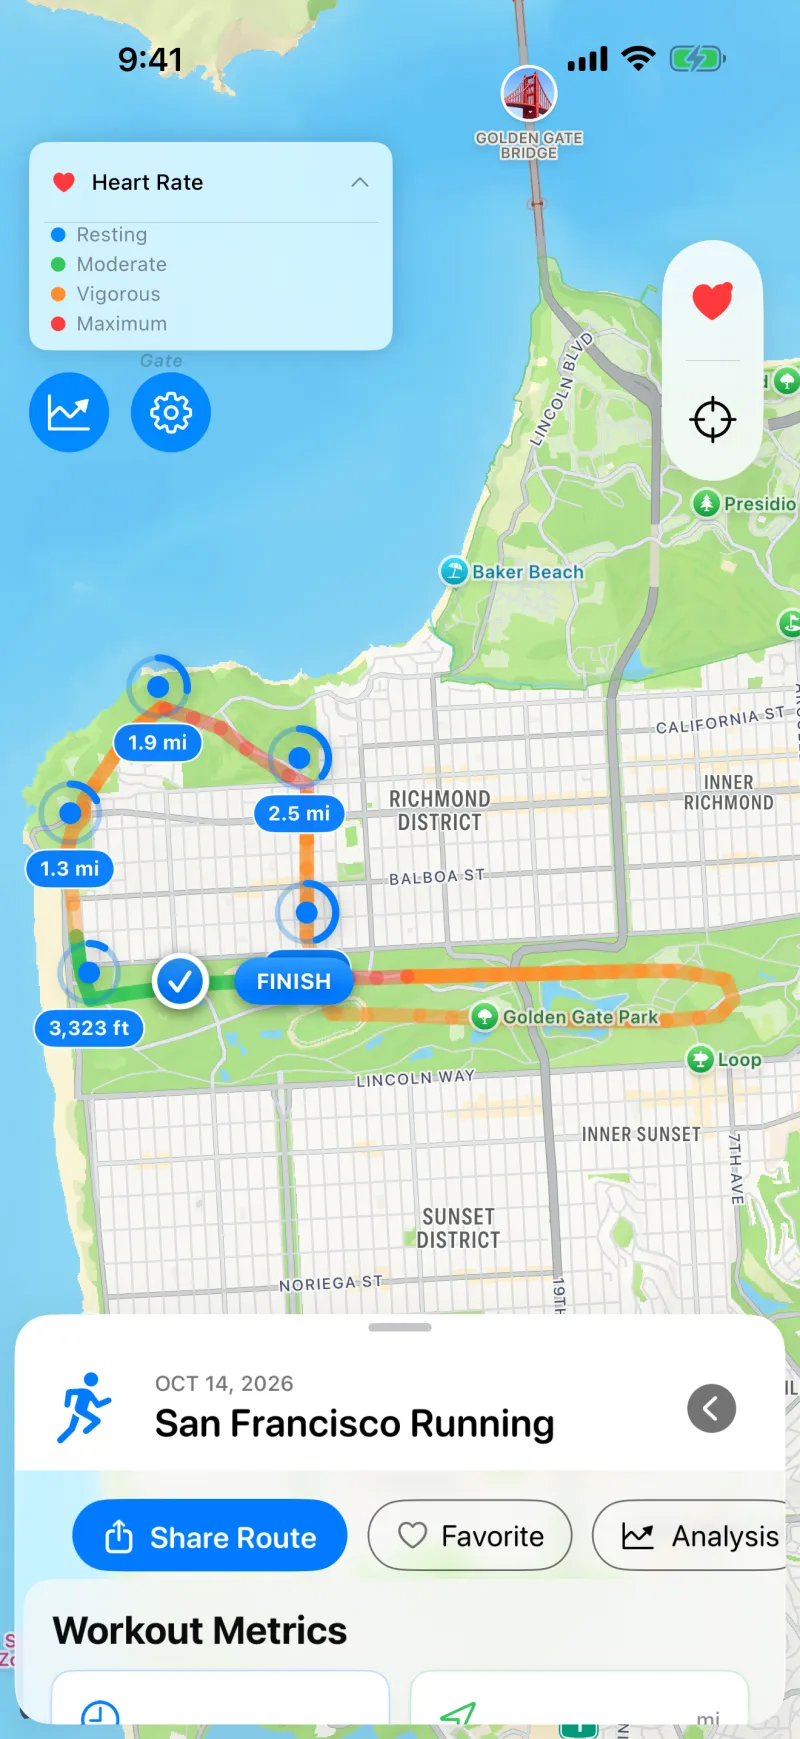
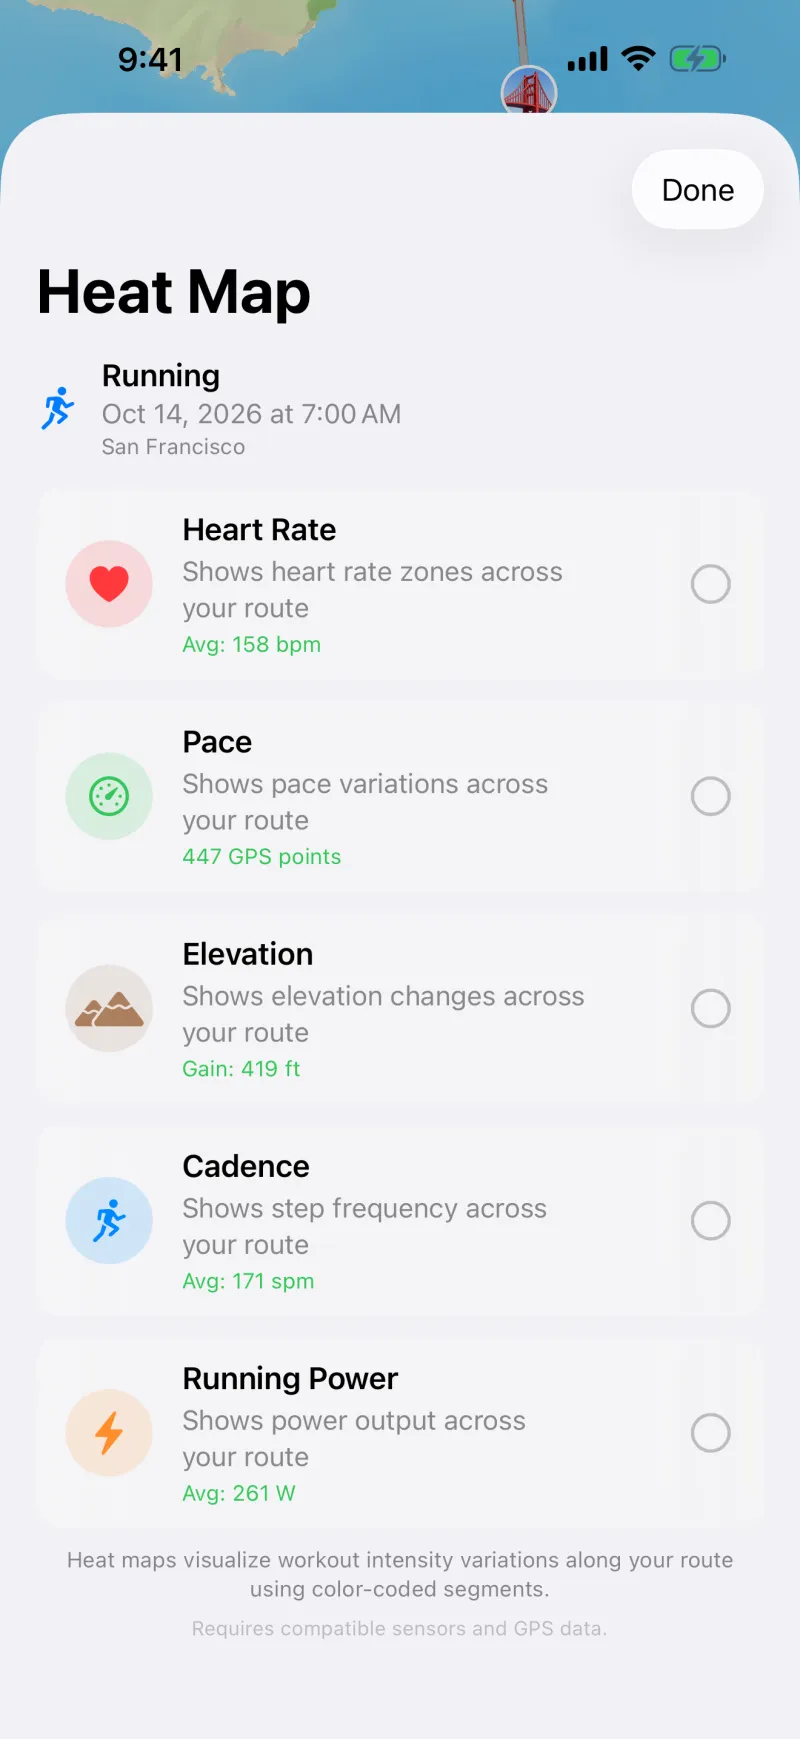
How these differ from all-routes heat maps
Many workout heat maps stack all your routes together to show where you go most. Workout Wanderer's heat maps look at one workout at a time, so you can see where it got faster, steeper, or harder. To see all your routes together, use the map of every route.
The eight heat maps
Heart rate
Shows your heart-rate zones across the route. Needs heart rate samples from a watch or monitor.
Pace
Shows how your pace changed across the route. Uses the GPS route.
Grade-adjusted pace
Shows your pace normalized for elevation gain and loss, so you can compare hilly and flat sections. Uses the GPS route and its elevation.
Elevation
Shows the elevation changes across the route. Uses the elevation saved with the route.
Cadence
Shows your step frequency across the route. Needs step data from the workout.
Running power
Shows your power output across the route. Needs a device that records running power.
Vertical oscillation
Shows your vertical bounce across the route. Needs a device that records vertical oscillation.
Effort
Shows your workout intensity, based on your power output and body weight. Needs running power, plus your body weight in Apple Health.
Using a heat map
- Open a workout with a route.
- Open the heat map options on the map.
- Choose a heat map. The route recolors, and a legend explains the colors.
A heat map can only show what your devices recorded, so some may be unavailable for a workout. On iPad, you can drag the legend anywhere on the map, and it remembers its spot for each heat map.
